I suspect you are at least partially correct with regard to aesthetics. Both dwarf and greenskin players are very loyal to their racial choices. However, I think you are underestimating another factor which is a well-built shammy is VERY hard to kill and people just don't like having their characters die (on average). Being able to run around RoR and have a significantly lower chance of dying is a powerful incentive.leftayparxoun wrote: Sat Feb 08, 2025 8:51 pm It's also very important to draw the right conclusions from the data and, even more so, to know when we cannot draw proper conclusions from it.
In the case of healer pop% in the last 2 days we see:
Destro
- Shaman = 45.0%
- Zealot = 26.5%
Order
- DOK = 28.5%
- Archmage = 32.1%
- Rune Priest = 27.0%
If population percentages were directly related to healer META performance then we'd be seeing Zealots and Runepriests in the first place instead of last for both realms.
- Warrior Priest = 41.9%
If population percentages were directly related to dps-healer META performance then we'd expect similar percentages for both Shaman and AM and potentially more for AMs due to them having a slightly better dps toolkit (1 more dot than Shaman). Instead we see a huge difference with Shaman at 45% and AM at 32%.
What, in my opinion, could be at play here is class appeal with regard to fashion and looks.
As a matter of personal opinion, I think Goblins look awesome. At least more so compared to a crackhead cultist or an emo-bloodgirl.
Similarly on Order I find a literal armored Warrior Priest way more aesthetically appealing than an elf with robes and a stick or a small hobo with a stick.
And potentially more people could share similar opinions regarding class looks and appeal, resulting in those percentages.
To reiterate what I said in the start; we must be very careful when handling and trying to explain data, as in many cases the explanation is multifaceted and not easily traceable from the data itself.
Just some population graphs
Re: Just some population graphs
Aethilmar 8x SM
Aenean 8x AM
Vusean 8x Chosen
Culwych 8x Magus
... and a host of others ...
Aenean 8x AM
Vusean 8x Chosen
Culwych 8x Magus
... and a host of others ...
Ads
Re: Just some population graphs
UPDATE: DiscordBot
I’ve been wanting to learn how to code a Discord bot, and this was a great opportunity to do it.
So I've created a small discord-bot that (for now) just relays (when asked) the latest data from the graph-page when it comes to population, kills and sc-info. If you want to try it out, you can add it to your server by following the instructions here: https://maartenson.net/ror_graph_bot.html.
I’ll likely add more functionality in the future, pulling data directly from the RoR API and possibly including event notifications—such as when an event starts or when a fort siege is detected.
/j - https://maartenson.net/ror_graph.html
Re: Just some population graphs
Example active zones:Wholdar wrote: Fri Feb 14, 2025 11:32 pm So I've created a small discord-bot that (for now) just relays (when asked) the latest data from the graph-page when it comes to population, kills and sc-info. If you want to try it out, you can add it to your server by following the instructions here: https://maartenson.net/ror_graph_bot.html.

Example war report:

And now with /-commands aswell:

/j
Re: Just some population graphs
Small DiscordBot-update - fixed some formatting - Discord have limited options though...

But alright, I hear you there in the back - "back to fixing graphs and percentages and stuff!".
BUT THE DISCORDBOT IS SO SHINY!
.. but ok, percentages...
/j - https://maartenson.net/ror_graph_bot.html
But alright, I hear you there in the back - "back to fixing graphs and percentages and stuff!".
BUT THE DISCORDBOT IS SO SHINY!
.. but ok, percentages...
/j - https://maartenson.net/ror_graph_bot.html
Re: Just some population graphs
Percentages achieved!guessgap wrote: Wed Feb 12, 2025 10:10 am one question: theres a nice percentage number showing up behind the careers, which is very helpful. unfortunately these percentages dont show up in the "order/destro careers" selection and its very hard to guess the amounts (impossible on longer timeframes).
would it be possible to show these percentages there too please?
Order:
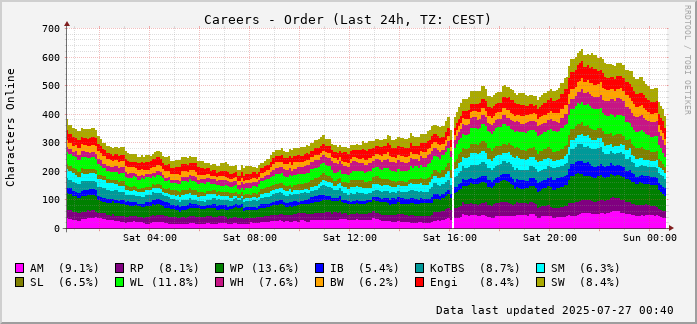
Destro:
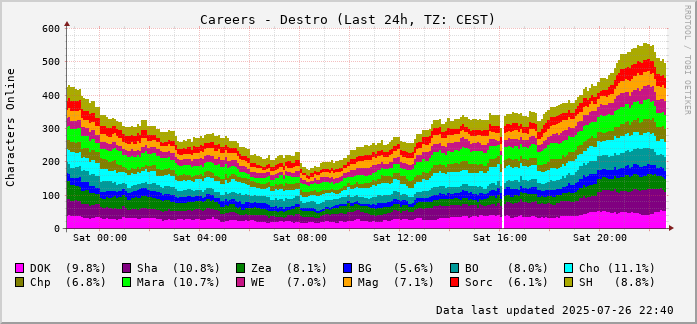
Hope that works.
/j - https://maartenson.net/ror_graph.html - https://maartenson.net/ror_graph_bot.html
Re: Just some population graphs
UPDATE: Archetype/Races/Career Graphs for CR40/T4
Could be a bit more relevant than what people are leveling, what classes they actually playing at 40+.
So heres that, will probably have pop-graphs for just T4 chars aswell. The DiscordBot already has a /popt4 command.
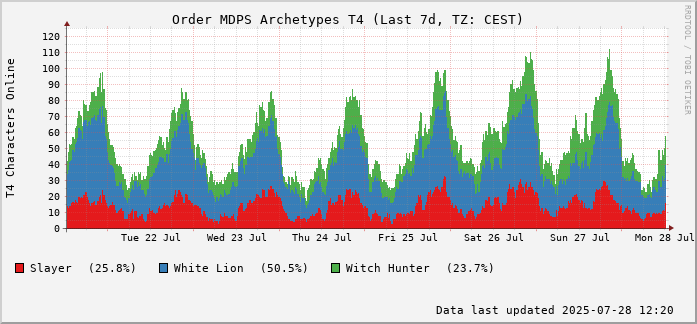
Direct-link to one of the graphs here: https://maartenson.net/ror_graph.html?g ... order-mdps
/j - https://maartenson.net/ror_graph.html - https://maartenson.net/ror_graph_bot.html
Could be a bit more relevant than what people are leveling, what classes they actually playing at 40+.
So heres that, will probably have pop-graphs for just T4 chars aswell. The DiscordBot already has a /popt4 command.
Direct-link to one of the graphs here: https://maartenson.net/ror_graph.html?g ... order-mdps
/j - https://maartenson.net/ror_graph.html - https://maartenson.net/ror_graph_bot.html
-
Toshutkidup

- Posts: 865
- Contact:
Re: Just some population graphs
What a world RoR we live in when WH's are played / created more than Slayers.. a class almost most people say is garbage for warbands.
First RR90 Slayer working towards the top of the mountain.I still solo, still run riposte.
Twitch:https://www.twitch.tv/toshutkidup
My Youtube http://www.youtube.com/c/Toshutkidup
Twitch:https://www.twitch.tv/toshutkidup
My Youtube http://www.youtube.com/c/Toshutkidup
Re: Just some population graphs
Small update... Since the API has been offline since the server restart today, I couldn’t tinker with what I had planned. Got bored, so I just built some pie charts of the current population (tiers selectable) instead.

Available at https://maartenson.net/ror_graph_pie.html if anyone’s interested.
/j
Available at https://maartenson.net/ror_graph_pie.html if anyone’s interested.
/j
Ads
Re: Just some population graphs
Small update again to the pie-charts.
Added RR60+ and RR80+ piecharts.
Note, these are inclued in the t2+ and the t4-pies aswell, but can be nice to be able to break it down.

Same data can also be gotten from the DiscordBot - https://maartenson.net/ror_graph_bot.html.
/j - https://maartenson.net/ror_graph_pie.html
Added RR60+ and RR80+ piecharts.
Note, these are inclued in the t2+ and the t4-pies aswell, but can be nice to be able to break it down.
Same data can also be gotten from the DiscordBot - https://maartenson.net/ror_graph_bot.html.
/j - https://maartenson.net/ror_graph_pie.html
Re: Just some population graphs
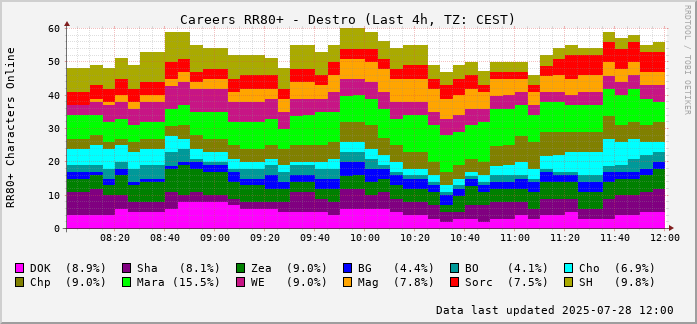
UPDATE: Graphs for RR60+ and RR80+
I've added graphs showing the number of RR60+ and RR80+ players online per category. (RR80+ is, of course, a subset of RR60+.)
Still sparse on data, but it will fill up over time.
Example - https://maartenson.net/ror_graph.html?gt=cr-rr80-order:
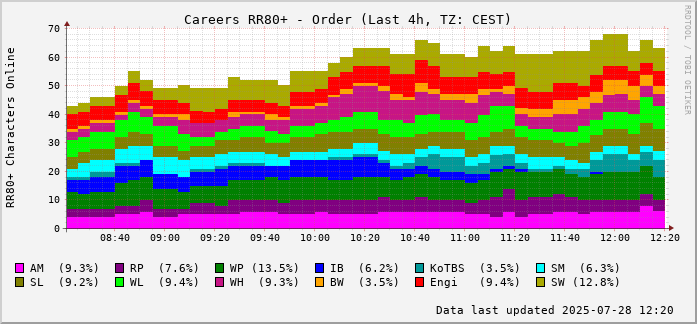
Another example - https://maartenson.net/ror_graph.html?gt=cr-rr80-destro:
/j - https://maartenson.net/ror_graph.html
https://maartenson.net/ror_graph_pie.html
https://maartenson.net/ror_graph_bot.html
I've added graphs showing the number of RR60+ and RR80+ players online per category. (RR80+ is, of course, a subset of RR60+.)
Still sparse on data, but it will fill up over time.
Example - https://maartenson.net/ror_graph.html?gt=cr-rr80-order:
Another example - https://maartenson.net/ror_graph.html?gt=cr-rr80-destro:
/j - https://maartenson.net/ror_graph.html
https://maartenson.net/ror_graph_pie.html
https://maartenson.net/ror_graph_bot.html
Who is online
Users browsing this forum: No registered users and 27 guests
Sitemap
Account
CSS 3 and HTML 5 compliant


Copyright © 2013 - 2024 Return of Reckoning Ltd. All rights reserved.